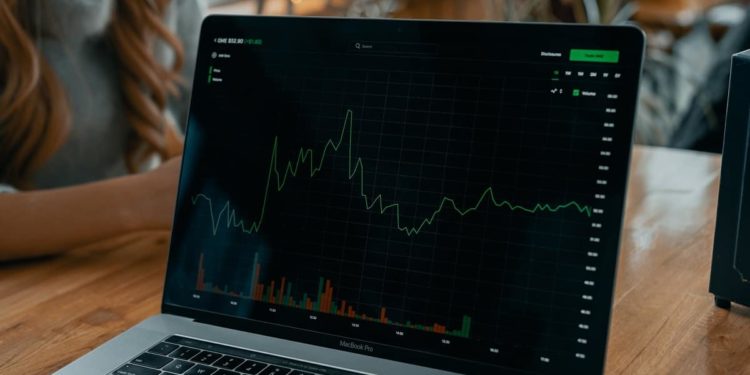
The RSI indicator measures the ratio of up to down moves and generalizes the calculation to express the index in a range of 0 to 100. If the RSI is 70 or above, you can assume that the instrument is overbought. On the contrary, if the RSI is 30 or lower, it is a signal that the instrument is oversold. You can learn how to use RSI in trading from the following strategies –
Table of Contents
RSI OBOS Levels
As mentioned earlier, the RSI less than 30 means that the market is oversold and the price may increase eventually. Once you confirm the reversal, you can place a buy trade. Conversely, when the RSI is over 70 and the market is overbought, the price may decline soon. After confirming this reversal, you can place a sell trade. The level 50 is the midline separating the Bullish (upper) and Bearish (lower) territories. Usually, the RSI is above 50 in an uptrend, and it is below 50 in a downtrend.
RSI Classic Divergence
RSI bearish divergence is formed when the price forms a higher high, and at the same time, the RSI decreases forming a lower high. Usually, you can see RSI divergence to form at the top of the bullish market. This is called a reversal pattern. Reversal is expected during the formation of RSI divergence. It is considered an advance reversal warning because it takes place several candlesticks ahead of the uptrend changing its direction and breaking below its support line.
Conversely, the RSI bullish divergence forms when a lower low is formed by the price. At the same time, a higher low is formed by the RSI. It warns that the direction of the trend may change from a downtrend to an uptrend. Forex technical analysts use RSI divergence widely. Some traders go for higher timeframes like 4-hour per day to trade RSI divergence. It is possible to achieve several RSI indicator buy and sell signals by using these strategies.
RSI Two Period Divergence
You can watch for crossovers by applying a short 5-period RSI over the long 14-period RSI. Sometimes, the market does not reach the overbought or oversold levels with the RSI 14 before a shifting direction takes place. A shorter period RSI can display early signs of reversals because it is more reactive to recent price changes. If the RSI 5 crosses over the RSI 14, it indicates the recent prices getting higher.
After that, a buy signal is generated. During this time, a 14 vs 5 cross should occur when the 5-period is below 30 and oversold. When the RSI 5 crosses lower than the RSI 14, it indicates the declination of recent prices. This is a sell signal. The cross also occurs when the 5-period is over 80 and overbought. Experienced traders can benefit greatly by combining an RSI trading strategy with Pivot Points.
RSI Trend lines
In this strategy, you can connect tops and bottoms on the RSI chart and trade the trend line break. For drawing an RSI uptrend line, three or more points can be connected on the RSI line as it rises. Similarly, you can draw a downtrend line by connecting three points or more on the RSI line as it falls. The break of the RSI trend line may indicate the potential price of price or a reversal. Keep in mind that the break of an RSI trend line generally precedes the trend line break on the price chart. Hence, it provides an advance warning, as well as a very early opportunity for trading.
Final Thoughts
Jumping into trading using the forex RSI indicator is so simple that beginner traders often start trading without educating themselves on the right use of the indicator or testing different parameters. This happens because of their desire to earn money quickly. As a result, the misuse of RSI has increased. You need to learn properly how to trade RSI because when you understand and apply it correctly; it can indicate when prices trend, when it is the best price to enter or exit a trade, and also when a market is oversold or overbought.
The RSI indicator can also point out the most active timeframe, and it offers information to determine major price levels of support and resistance. Moreover, the indicator can provide the traders with technical trend information, and RSI buy and sell signals. However, it is essential to practice the trading strategies on a demo account before applying them on a live account.
Latest Posts:-


